IRVINE, CA — October 10, 2025 — EON Reality, the global leader in Artificial Intelligence-powered augmented and virtual reality-based knowledge transfer for industry and education,, today announced a foundational advancement for its Virtual Campus product line: the launch of Knowledge Transfer Efficiency (KTE) — a unified benchmark for measuring the real-world impact of education. With KTE, EON aims to shift the narrative from credentials and credit hours to actual learning outcomes, efficiency, and value — positioning itself not just as a technology provider, but as the standard-setter for educational effectiveness in the consumer era. For an in-depth analysis, please see the white paper “Benchmarking Knowledge Transfer- Defining the GDP of Learning.”
Click on the image below to access a full presentation.

Why We’re Doing This
- Broken metrics, broken system: Traditional higher education remains locked in metrics like credit hours, GPAs, and degree counts — proxies that poorly represent what learners actually retain, apply, or benefit from in their careers.
- Online delivers scale, not mastery: Digital platforms scale access, but often yield low completion, weak retention, and limited real-world utility.
- EON’s potential to lead: With its immersive XR labs, AI Brainy mentors, and virtual campus architecture, EON has the infrastructure to not only deliver learning — but to measure it meaningfully. KTE is how EON turns its internal performance into external credibility.
- Defining the future of education: Just as GDP became the benchmark that defined economies, EON seeks to make KTE the benchmark that defines the quality, efficiency, and value of education globally.
What KTE Entails & How It Works
1.Definition & Formula
KTE (Knowledge Transfer Efficiency) is defined as:
\text{KTE} = \frac{\text{Applied Mastery % × Retention Duration}}{\text{Time to Mastery × Cost Index}}
- Applied Mastery %: the proportion of learners who achieve functional competency (not just passing a test).
- Retention Duration: how many months learners retain capability.
- Time to Mastery: how long (in months) learners need to reach competency.
- Cost Index: relative cost per learner (baseline = traditional university = 1.0).
2.Data Collection & Validation
- Assessments across three streams: XR mission performance, Brainy AI conversation viva, and written evaluation.
- Analytics logs and audit trails feed retention curves (e.g. revisit intervals, decay of performance).
- Cost modeling includes infrastructure, support, content development, and license amortization.
- Independent audit or third-party review ensures KTE is measured fairly and transparently.
3.Visualization & Reporting
- Radar charts display performance across seven dimensions: Speed, Retention, Engagement, Applied Performance, Cost/Scalability, Accessibility, and Career Impact.
- Bar charts / KTE indices compress it into a single relative score (e.g. 2×, 4×).
- Dashboards for learners, institutions, and partners visualize how each cohort or course compares against benchmarks.
Before vs After — Benchmarking Across Paradigms
| Paradigm | Radar Profile | KTE Index* |
|---|---|---|
| Traditional University | Moderate retention and outcomes, weak speed & cost | 1.0 (baseline) |
| Community College | Slight improvements in cost/accessibility | ~1.2 |
| K–12 Schools | Good retention, weak outcomes and speed | ~1.4 |
| Online Learning (MOOCs) | Strong cost/scale, poor engagement or retention | ~2.0 |
| EON Generic Virtual Campus | Balanced performance across dimensions | ~3.0 |
| EON Custom–Institutional | Higher outcomes, aligned content, local relevance | ~4.0 |
| EON Enhanced Custom (B2C) | Full stack: certification, career linkage, assessments | ~5.2 |
* Sample indices based on internal modeling and benchmarking assumptions.
These visuals and indices make the jump from theory to proof: EON’s models show a dramatic leap in measurable knowledge transfer.
Before vs After — Comparative Benchmarking
Figure 1: Radar Chart – Multidimensional Comparison
- Traditional models show uneven strength, excelling in reputation or access but failing in speed, cost, and long-term retention.
- Online models show reach but collapse on engagement.
- EON models fill the radar, delivering balanced excellence across all dimensions.

Figure 2: Bar Chart – KTE Index
- Traditional Univ = 1.0 (baseline).
- Online Learning = 2.0.
- EON Generic VC = 3.0.
- EON Custom VC = 4.0.
- EON Enhanced VC = 5.2.
Headline insight: EON’s Virtual Campus delivers up to 5× higher knowledge transfer efficiency than traditional universities.

Use Cases in Action
1.University English Program (UCR)
-
- University delivers level-based English courses via EON Custom Campus.
- Learners complete grammar and rhetoric XR modules, debate via Brainy, and mission tasks.
- KTE shows 4× efficiency over traditional courses; retention 12+ months; strong learner outcomes in writing, transfer credit, and employability.
2.Vocational / Technical Training
-
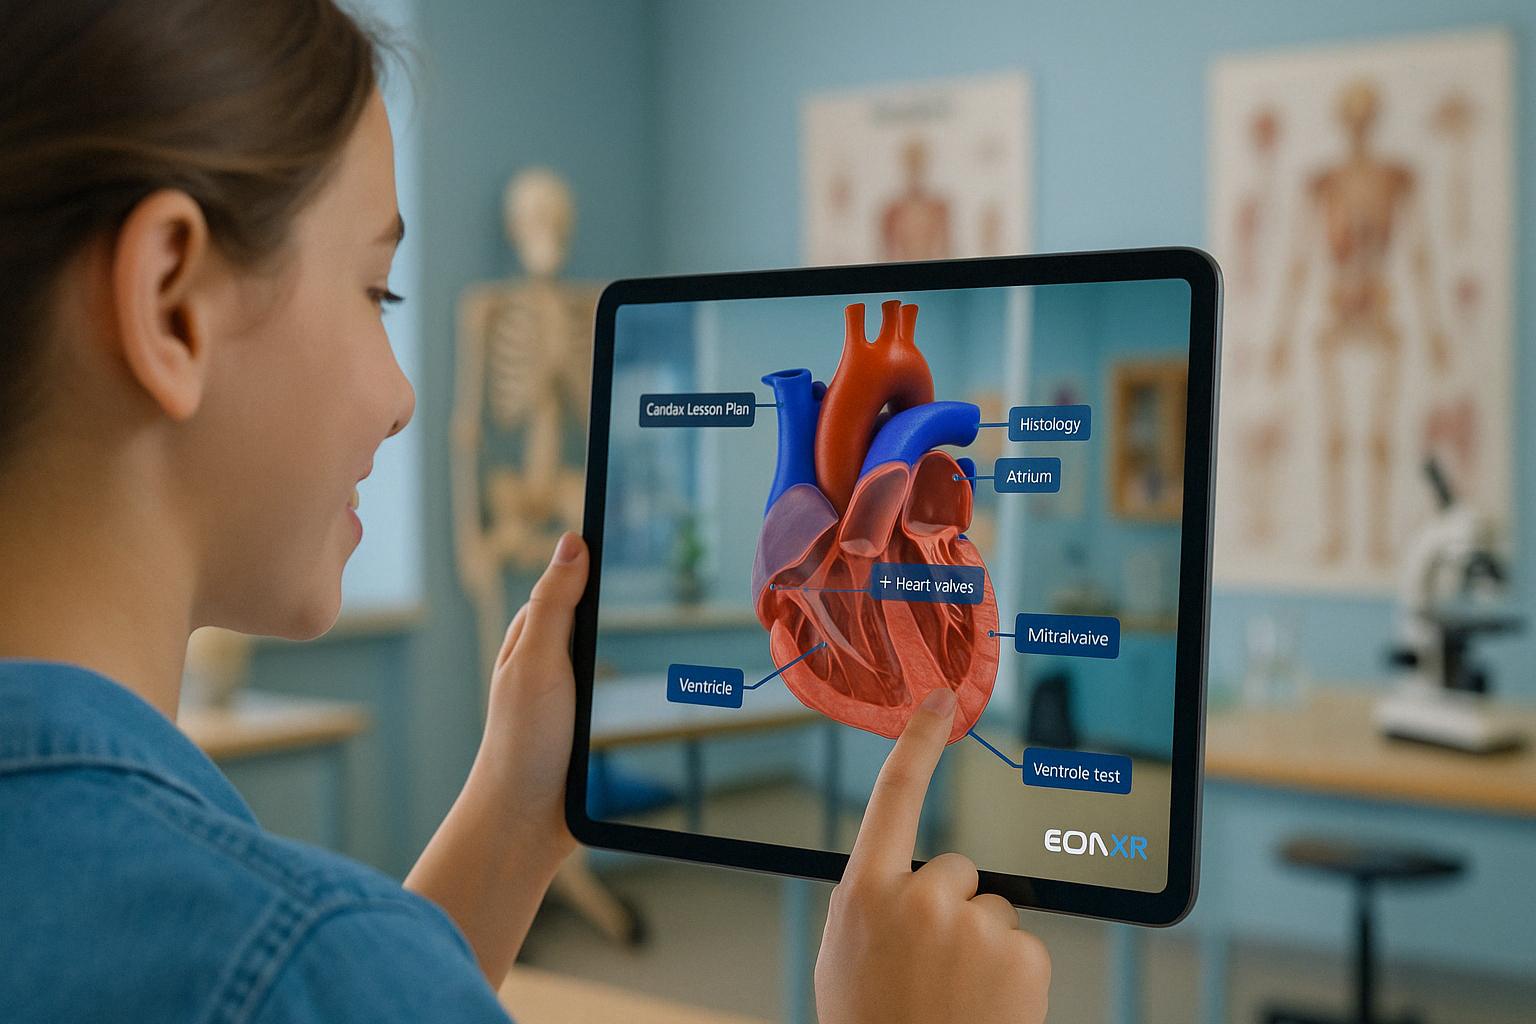
- Forensics, nursing, or manufacturing labs simulated in XR (no physical lab).
- Students practice in virtual labs repeatedly.
- EON’s KTE index confirms significant cost and time advantages, equal or improved competency over in-person labs.
3.Corporate Upskilling & Compliance
-
- SOPs and training modules converted to XR missions + Brainy role-play.
- Compliance teams can benchmark skill uptake, retention, and applied performance across global cohorts.
4.Global Low-Bandwidth Regions
-
- Students in remote areas use PWA and offline XR fallback modes.
- KTE captures how effectively these students learn, showing EON’s reach and fairness in previously excluded environments.
Strategic Impact & Market Positioning
- EON as educator & standard bearer: By embedding KTE into every Virtual Campus deployment, EON moves from vendor to the authority on educational efficiency.
- Differentiation vs legacy & online: EON’s ability to not just claim better outcomes but measure them gives EON unmatched credibility.
- Policy & industry appeal: Governments, accreditors, and employers can compare institutions on value per learner rather than just reputation.
- Marketing & sales leverage: “5× more efficient learning” becomes not just a claim, but an empirically grounded benchmark.
Read more in the complete white paper. Learn more by tuning to our podcast.

About EON Reality
EON Reality is the world leader in AI-assisted Augmented and Virtual Reality-based knowledge transfer solutions for education and industry. With over 25 years of experience and a global presence across six continents, EON Reality has pioneered innovative technologies including the EON-XR platform, AI-powered learning frameworks, and immersive training solutions. The company is dedicated to making knowledge accessible worldwide through cutting-edge technology, serving millions of learners across educational institutions and enterprises globally. For more information, visit www.eonreality.com